How Asset Management Companies Make Money in 2026 (Fee Breakdown)
Management fees, performance fees, carried interest, and ancillary revenue — exactly how asset management firms generate billions, with worked examples.
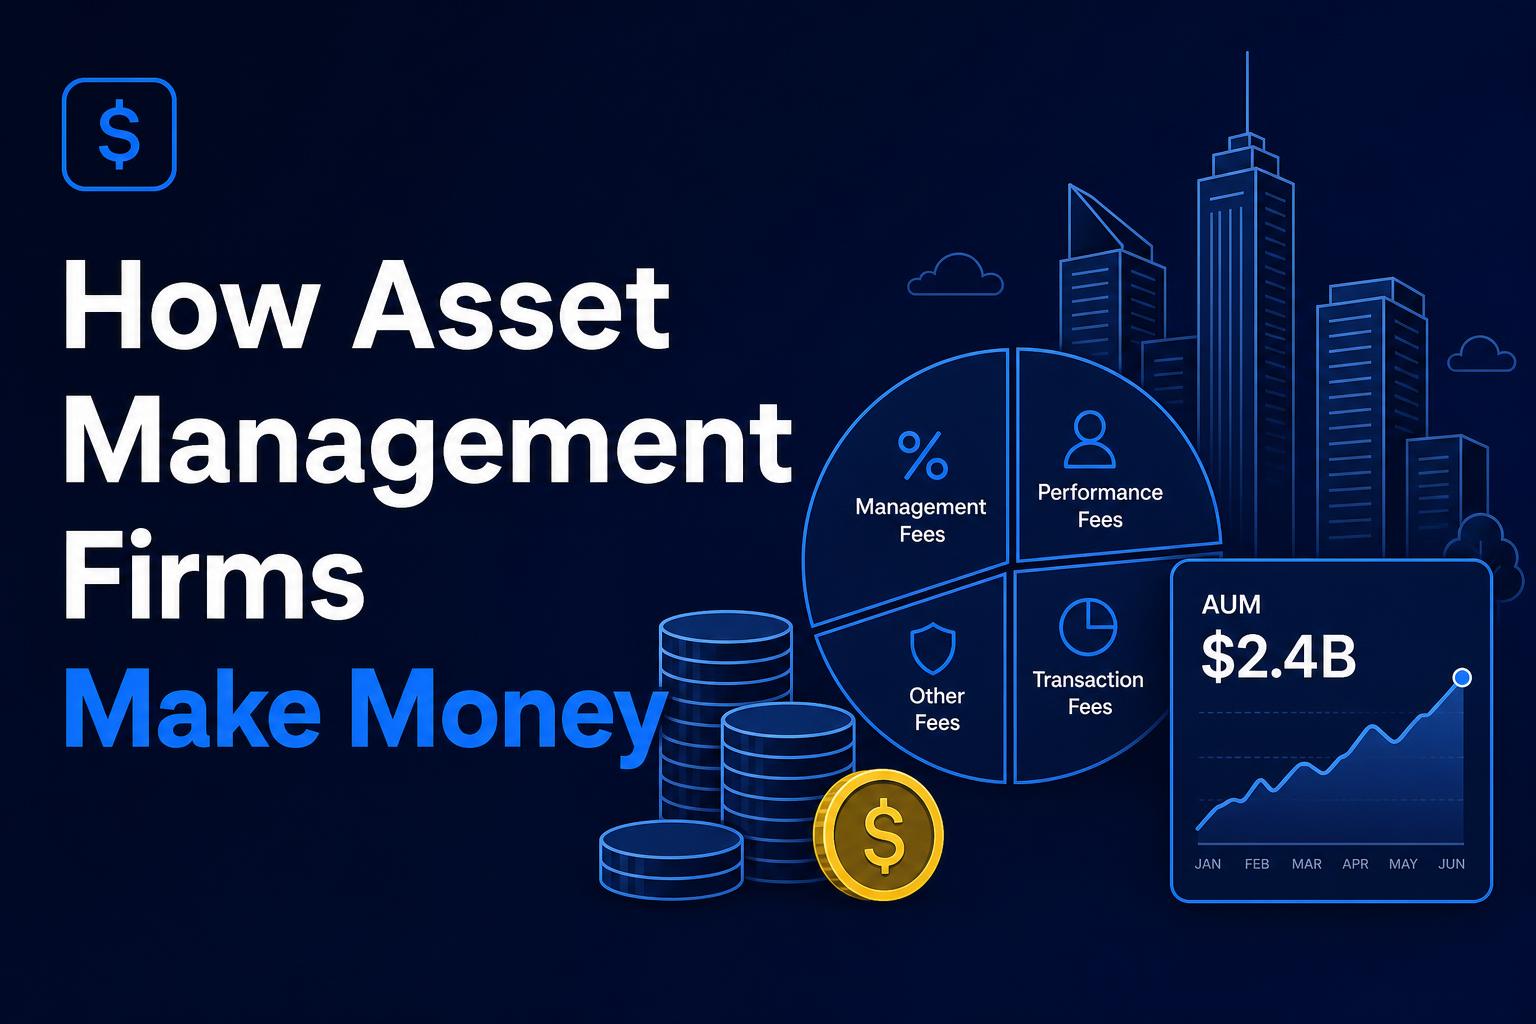
Asset management companies make money through four fee types: management fees (0.5%–2% of AUM annually), performance fees or carried interest (typically 20% of profits above an 8% hurdle), transaction and advisory fees on deals, and ancillary revenue from property management, leasing, and financing services. A firm managing $5B can generate $80M–$150M in annual revenue by stacking these streams on the same investor capital.
Asset management fee types at a glance
| Fee type | Typical range | Who pays | Real-world example |
|---|---|---|---|
| Management fee (AUM) | 0.5%–2.0% annual | Investors / LPs | $10M/yr on $1B AUM at 1.0% |
| Performance fee / carry | 20% over 8% hurdle | Investors | $20M on $100M profit above hurdle |
| Transaction fee | 0.5%–1.5% of deal | Fund / asset | $5M on a $500M acquisition |
| Property mgmt fee | 3%–6% of gross revenue | Asset | $300K/yr on $5M NOI building |
| Leasing commission | 4%–6% of lease value | Asset | $120K on $2M 10-yr lease |
| Construction mgmt | 3%–5% of project | Asset | $150K on $5M capex |
The four ways every asset management company earns revenue
When people ask how asset management companies make money, the honest answer is: through a stack of overlapping fee streams that compound on the same pool of investor capital. A firm managing a $5 billion real estate portfolio can plausibly generate $80–$150 million of annual revenue from the same assets — not because it picked particularly good buildings, but because the fee architecture lets it bill investors in four or five different ways for related work.
This guide breaks down each revenue stream with real-world ranges, walks through the math on a representative $500M fund, and explains why the industry's economics are shifting in 2026. If you're an LP evaluating fee terms, an emerging GP designing your first fund, or an operator trying to understand how the firm you work for actually makes money, this is the breakdown you need.
Quick context: Real-estate asset managers fall into three broad categories — traditional fund managers (Blackstone, Brookfield, Starwood), institutional advisors managing separate accounts for pensions and sovereigns, and vertically integrated owner-operators that combine asset management with property management. The fee mix shifts depending on which model you're looking at.
1. Management fees: the baseline revenue engine
Management fees are the steady, predictable revenue that keeps the lights on. They are calculated as a percentage of either committed capital, invested capital, or net asset value (NAV) depending on the fund vehicle.
How management fees are structured
| Fund Type | Typical Base Fee | Calculation Basis | Notes |
|---|---|---|---|
| Closed-end opportunistic fund | 1.5% | Committed capital during investment period, then invested capital | Highest fee tier; aligned with 20% carry |
| Closed-end value-add fund | 1.25% | Same as above | Slightly lower than opportunistic |
| Open-end core fund | 0.85% | NAV | Continuous; no investment period step-down |
| Separate account (SMA) | 0.40%–0.75% | Invested capital or NAV | Negotiated; volume-driven |
| Non-traded REIT | 1.0%–1.5% | NAV | Plus distribution fees |
| Public REIT (externally managed) | 0.5%–1.0% | Total equity or gross asset value | Increasingly self-managed to eliminate this fee |
For a $1 billion closed-end fund at a 1.5% fee, the manager earns $15 million annually just on the management fee — every year, regardless of performance. Over a 10-year fund life, that's $150 million in baseline revenue before a single building is sold profitably.
Why the calculation basis matters
A 1.5% fee on committed capital is dramatically more lucrative than 1.5% on invested capital in years one through three of a fund. If your $1B fund has only deployed $200M in year two, "invested capital" math gives the manager $3M; "committed capital" math gives them the full $15M.
That difference is why sophisticated LPs negotiate hard for invested-capital math, and why managers fight to keep committed-capital math at least through the investment period. The compromise is usually a two-tier structure: committed during the investment period (typically years 1–5), invested afterward.
The step-down
After the investment period ends, most closed-end funds step down to a lower fee — often from 1.5% to 1.25% or 1.0%, calculated on invested capital. This reflects the reality that the GP is no longer hunting deals, just managing what they've already bought.
2. Performance fees and carried interest: where the real money is
If management fees are how asset managers earn a living, performance fees are how they get rich. Carried interest — the GP's share of profits above a hurdle — is the largest single line item in compensation for senior partners at most private equity real estate firms.
The 2 and 20 model (and its variants)
The classic structure originated with hedge funds: 2% annual management fee + 20% performance fee on profits above a hurdle rate. In real estate, the dominant flavor is:
- LPs receive 100% of capital back
- LPs receive a preferred return (typically 8% IRR)
- GP catch-up: the GP receives 100% of the next dollars until the overall split equals 80/20
- Remaining profits split 80/20 (LPs/GP)
This is called a European waterfall when applied across the whole fund. The American waterfall applies the same logic deal-by-deal, which is more favorable to the GP because winning deals pay carry even while losing deals are still underwater.
What carried interest actually pays
Consider a $500M fund that generates a 1.6x equity multiple over 7 years (a respectable but not extraordinary outcome):
- Invested capital: $500M
- Total distributions: $800M
- Profit: $300M
- Preferred return owed to LPs (8% IRR over 7 years): ~$355M cumulative... but only the portion above invested capital, so this consumes most of the profit
- After pref, GP catch-up and 80/20 split kick in
In simplified math, on a 1.6x outcome the GP carry might equal $25M–$40M depending on hurdle structure and fund duration. On a 2.0x outcome — a strong but achievable result — the carry can exceed $100M on the same $500M fund.
Carry as % of total GP compensation
For mid-size to large real estate PE firms, partner-level economics typically break down as:
- Base salary: 5%–10% of total compensation
- Annual bonus: 10%–20%
- Co-investment returns: 15%–25%
- Carried interest: 50%–70%
Which is why GPs will defend the 20% carry economics far more aggressively than they'll defend a 25 basis-point management fee cut.
3. Transaction, advisory, and acquisition fees
Beyond the base fee stack, asset managers earn substantial revenue from one-time events. These fees are often less scrutinized by LPs but can add 30–80 basis points of effective annual yield to the GP.
Acquisition fees
When the fund buys a property, the manager typically charges an acquisition fee of 0.5%–1.5% of purchase price. On a $200M acquisition, that's $1–3M in immediate revenue. Some funds rebate this against the management fee (LP-friendly); others stack it on top (GP-friendly).
Disposition fees
Symmetric to acquisition fees — when the fund sells, the manager charges 0.5%–1.0% of sale price. On a $300M disposition, $1.5–3M.
Financing and refinancing fees
When the fund places debt on a property (or refinances), the manager typically takes 0.25%–1.0% of loan proceeds. On a $150M refinancing, that's $375K–$1.5M.
Development and construction management fees
For value-add and opportunistic strategies, construction management fees of 3%–5% of hard costs are standard. A $50M ground-up development generates $1.5M–$2.5M in construction management revenue.
Asset management fees at the property level
Distinct from the fund-level management fee, many firms charge an asset management fee of 0.25%–0.50% of gross asset value at each property, on top of the fund-level fee. LPs often miss this because it's buried in property-level financials rather than fund-level reporting.
The hidden math: A vertically integrated manager can plausibly stack 1.5% (fund management) + 0.4% (property AM) + 1.0% (acquisition) + 0.5% (financing) + 4% (construction) + 1.0% (disposition) on a single asset over its hold period. On a $100M asset with $20M of capex, total fees over a 5-year hold can exceed $14M — meaning the manager earns roughly 14% of asset value in fees alone, before carried interest.
4. Ancillary revenue: property management, leasing, and services
Vertically integrated asset managers — those that own the property management company in addition to the fund management entity — generate substantial revenue from operating the buildings themselves. For firms like Greystar, Cortland, or RXR, ancillary services can equal or exceed AUM-based fees.
Property management fees
Charged for day-to-day operations: rent collection, tenant communication, maintenance dispatch, financial reporting. Industry standard is 3%–6% of gross rental income, with the higher end for residential and the lower end for net-leased commercial. A 500-unit multifamily property generating $8M of gross rents pays $240K–$480K annually in property management fees.
This is the operational layer where modern property management software directly drives margin: every hour of manual work eliminated, every late fee captured, every vendor invoice processed automatically flows to the manager's bottom line — not the LP's.
Leasing commissions
Either paid to in-house leasing teams or external brokers. For commercial leases: 4%–6% of total lease value (rent × term), often split 50/50 between the listing and procuring brokers. For residential: typically 50%–100% of one month's rent per new lease.
A 100,000 SF office lease at $50/SF for 10 years equals a $50M lease, generating $2M–$3M in commissions. Even after splits with the procuring broker, the manager's leasing team can take home $1M–$1.5M from a single deal.
Construction services
Larger firms operate in-house general contracting or construction management arms that bid on tenant improvements and capital projects within their own portfolio. Standard fees: 3%–5% of project cost, plus markup on subcontracted work.
Insurance and risk services
Some firms operate captive insurance entities that underwrite property and liability coverage for portfolio assets, earning underwriting profit plus broker commissions.
Energy and ESG services
Newer revenue line. Firms increasingly charge separate fees for energy management, solar power purchase agreements, EV charging revenue share, and ESG reporting. Typically 5%–15% of net energy savings or revenue generated.
5. The 2026 fee compression story
The 25-year trend in asset management economics is unambiguous: fees compress. LPs have grown more sophisticated, gatekeeper consultants compare fee terms across managers, and the supply of capital is increasingly concentrated in a few mega-managers who can underwrite tighter terms.
What's compressing
| Fee component | 2010 average | 2026 average | Direction |
|---|---|---|---|
| Opportunistic fund mgmt fee | 1.75% | 1.40% | ⬇ |
| Carry hurdle | 8% IRR | 7% IRR (some at 9%) | mixed |
| Carry rate | 20% | 17.5% | ⬇ |
| Acquisition fee | 1.0% | 0.5% (or rebated) | ⬇ |
| Property mgmt (institutional) | 4.0% | 2.75% | ⬇ |
What's holding up (or growing)
- Construction management fees — supply-constrained, hard to negotiate down
- Performance fees on core funds — new addition, growing 20–30 bps of effective yield
- Co-investment fees — managers increasingly charge LPs for the privilege of investing additional capital alongside the fund (zero/zero historically, now 0.5%/10% common)
- Fund administration & technology pass-throughs — managers passing more operational cost to the fund
The net effect: total economics on a representative fund have compressed roughly 15–20 basis points per year of fund life, but managers have offset most of that by adding new fee categories and aggressive expense recovery.
6. How the math works on a representative fund
Let's run the numbers on a $1 billion value-add real estate fund with a 10-year life, 5-year investment period, generating a 1.7x equity multiple.
Management fees over 10 years:
- Years 1–5 (committed): 1.5% × $1B × 5 = $75M
- Years 6–10 (invested, stepped down to 1.25%): 1.25% × $800M avg × 5 = $50M
- Subtotal management fees: $125M
Transaction fees:
- Acquisitions: 0.75% × $1.4B gross purchases = $10.5M
- Dispositions: 0.5% × $2B sale proceeds = $10M
- Financing: 0.5% × $900M of debt placement = $4.5M
- Subtotal transaction fees: $25M
Performance fee (1.7x outcome):
- Equity returned: $1.7B
- Profit: $700M
- After 8% pref and catch-up, GP carry ≈ $90M
- Subtotal carry: $90M
Total GP economics on $1B fund: ~$240M over 10 years
- = 24% of fund equity
- = 2.4% per year of effective economics
Now layer in the ancillary stack (property management, leasing, construction) and a vertically integrated firm can extract another $50–$100M of revenue from the same portfolio. The headline 2-and-20 understates total economics by a factor of 1.5–2x.
7. Why operational software determines real margin
Here's the unspoken truth: management fees, carry, and transaction fees set the revenue ceiling. Operational efficiency sets the profit floor. The gap between a well-run asset manager and a poorly run one isn't fee strategy — it's how much of those fees survives operating expenses.
The most expensive cost center inside any institutional real estate firm is people: asset managers, accountants, property managers, lease administrators, construction managers, investor relations. A manager that needs 1 FTE per $50M of AUM is structurally less profitable than one that needs 1 FTE per $150M, regardless of fee architecture.
That ratio is determined almost entirely by technology adoption:
- Automated rent collection vs. manual invoicing
- AI-driven lease abstraction vs. paralegal extraction
- Real-time portfolio reporting vs. month-end Excel rollups
- Integrated maintenance vs. siloed work-order systems
- AI agents handling tenant communication vs. junior PM time
This is precisely where modern platforms like Pickspace replace 4–6 disconnected legacy systems with a single operating platform — covering property management, financials, maintenance, leasing, and tenant experience in one stack. For a firm managing $2B AUM, eliminating two FTEs per $100M of AUM by consolidating onto a unified platform translates to $4–8M of annual EBITDA improvement — pure margin that flows to the GP, not the LPs.
For a deeper look at how this operational layer compares across vendor choices, see our analysis of property management software for commercial portfolios and our PMS feature checklist for the must-have capabilities institutional asset managers should require in 2026.
8. How LPs evaluate fee structures
Sophisticated LPs (pension funds, sovereign wealth, large endowments) evaluate fees through three lenses:
1. Total expense ratio (TER)
The all-in cost of being invested, including base fee, fund expenses, organizational expenses, and indirect expenses. Top-quartile real estate funds run a TER of 1.5%–2.0%; bottom-quartile, 3.0%+.
2. Net-to-gross spread
How much of gross fund returns the LP actually keeps. A fund delivering 15% gross IRR with a 3% TER and 20% carry above 8% delivers roughly 10% net IRR. That 5-point spread is the GP's economics on the deal.
3. Alignment of interests
GPs investing meaningful personal capital alongside LPs (typically 1%–5% of fund) align outcomes. Funds where the GP contributes <1% are increasingly screened out.
9. Compliance, reporting, and operational requirements
None of these revenue streams are passive. SEC registration, AIFMD compliance in Europe, LP reporting standards, ILPA reporting templates, and quarterly NAV calculations all require infrastructure. For mid-size managers ($1B–$5B AUM), institutional reporting requirements alone consume 8–12 dedicated FTEs.
For a parallel discussion of operational compliance at the property level, see our guide to property management legal compliance.
10. The takeaway: a layered, compounding revenue model
Asset management companies don't make money from one fee — they make money from a stack of fees on the same dollar of investor capital, repeated annually for 10+ years, multiplied by operational and transactional events along the way, then crowned with carried interest if performance hits the hurdle.
The headline "2 and 20" understates total economics by roughly 1.5–2x for vertically integrated managers. The actual all-in take, before LP-side expenses, frequently equals 20%–30% of total equity returned over a fund's life.
For LPs, the practical implication is to scrutinize the full fee stack — not just management fee and carry — and to favor managers whose operational tech stack and lean staffing model preserves more of the gross return as net return.
For GPs, the lesson is equally clear: in a fee-compressed era, operational margin is the only lever fully under your control. Investing in the right platform for property and asset management is no longer an IT decision — it's a fund economics decision.
Ready to see how a modern operating platform changes the math for your fund? Book a 30-minute demo and we'll walk through how leading institutional managers are using Pickspace to operate $500M+ portfolios with fewer FTEs and tighter reporting cycles.
Further reading: What is property management software · How to choose property management software · Property management software vs. spreadsheets
See Pickspace in action
Want this in your portfolio? Get a guided 20-minute tour.
Tailored to your property type. No credit card.
Frequently asked questions
+
+
+
+
+
+
+
+
Run your portfolio on Pickspace
Get a personalized walkthrough — built around your property type, your workflows, and your team.
Personalizada para tu tipo de propiedad · Sin tarjeta · 20 minutos